Feature Importance Analysis
An interpretation of feature importance can provide a better understanding of relationships between structures and properties.
Given that the attention scores measure how much it should pay attention to the inputs when predicting the desired properties,
the attention layers of the Transformer allow assigning high attention scores to the input features according to their importance.
As such, we can analyze feature importance using attention scores from fine-tuning models.
PatchVisualizer is a class that visualizes structures with attention scores.
from visualize import PatchVisualizer
Visualization
In this sectinon, you will analyze feature importance with the finetuned model we’ve provided. you need to download the finetuned models (e.g. band gap, h2 uptake)
$ moftransformer download finetuned_model -o ./examples
please refer to dataset.md to download the ckpt files
Here is an example to build PatchVisualizer with a cif file:
from moftransformer.visualize import PatchVisualizer
from moftransformer.examples import visualize_example_path

model_path = "examples/finetuned_bandgap.ckpt" # or 'examples/finetuned_h2_uptake.ckpt'
data_path = visualize_example_path
cifname = 'MIBQAR01_FSR'

vis = PatchVisualizer.from_cifname(cifname, model_path, data_path)
vis.draw_graph()
or You can build PatchVisualizer with a directory that contains cif files.
In this case, you can choose the cif file by index.
from moftransformer.visualize import PatchVisualizer
from moftransformer.examples import visualize_example_path

model_path = "examples/finetuned_bandgap.ckpt" # or 'examples/finetuned_h2_uptake.ckpt'
data_path = visualize_example_path
batch_id = 0

vis = PatchVisualizer.from_index(0, model_path, data_path)
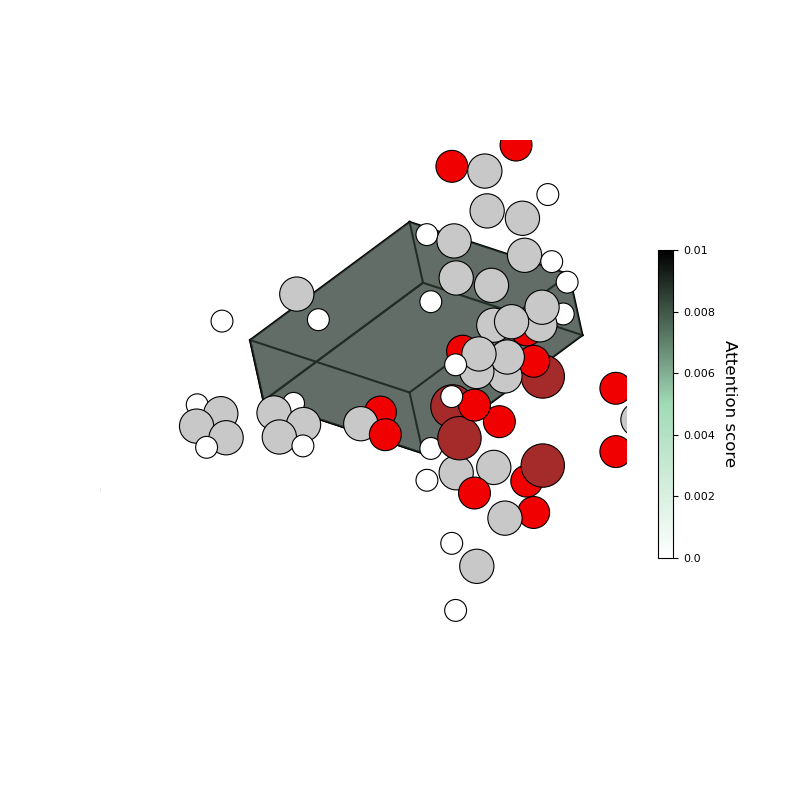
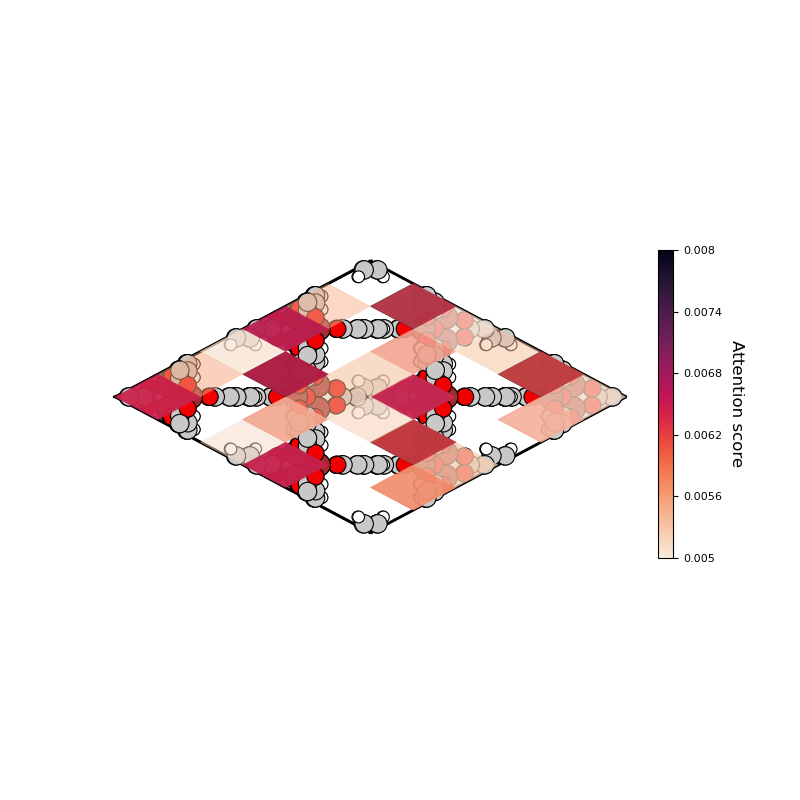
Visualize Atom-based Graph Embeddings
Here is an example of visualization with attention scores of atom-based graph embeddings:
%matplotlib widget
vis.draw_graph()
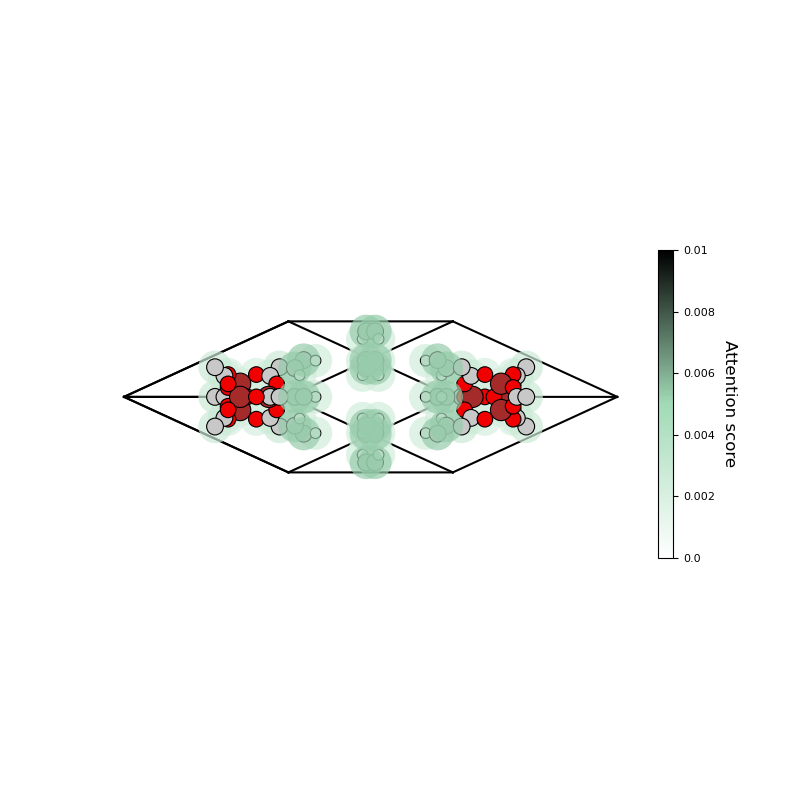
You can change some parameters of visualization that belong to parameters of matplotlib:
%matplotlib widget
minatt, maxatt = 0.002, 0.006
view_init=(0, -55)
cmap = 'rocket_r'
alpha = 0.5
grid_scale_factor = 1.8
atomic_scale_factor = 1.5
att_scale_factor= 3
vis.draw_graph(minatt=minatt, maxatt=maxatt, view_init=view_init, alpha=alpha, cmap=cmap,
               grid_scale_factor=grid_scale_factor,
               atomic_scale_factor=atomic_scale_factor,
               att_scale_factor=att_scale_factor)
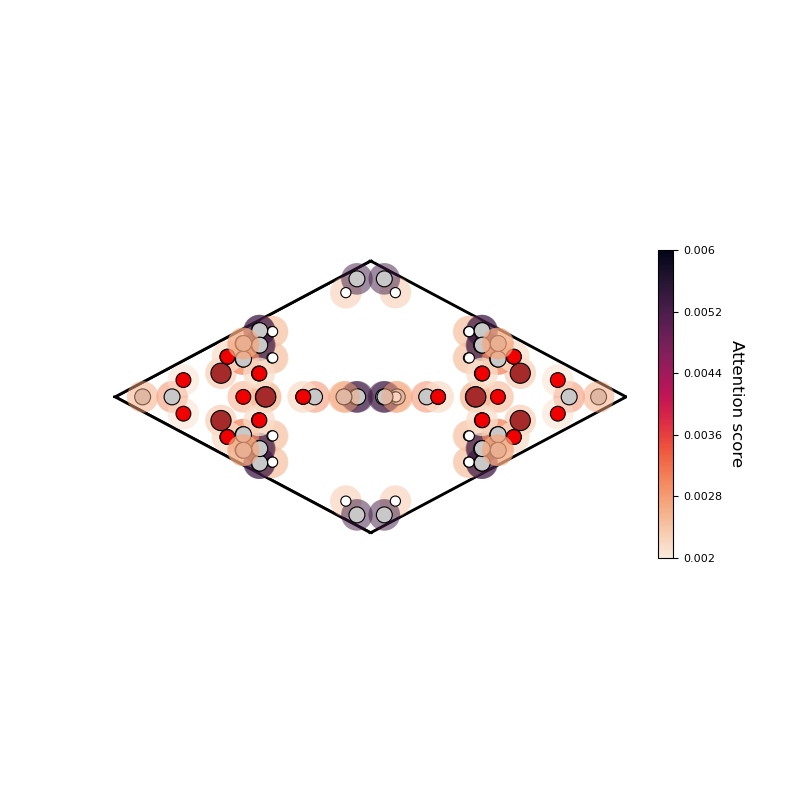
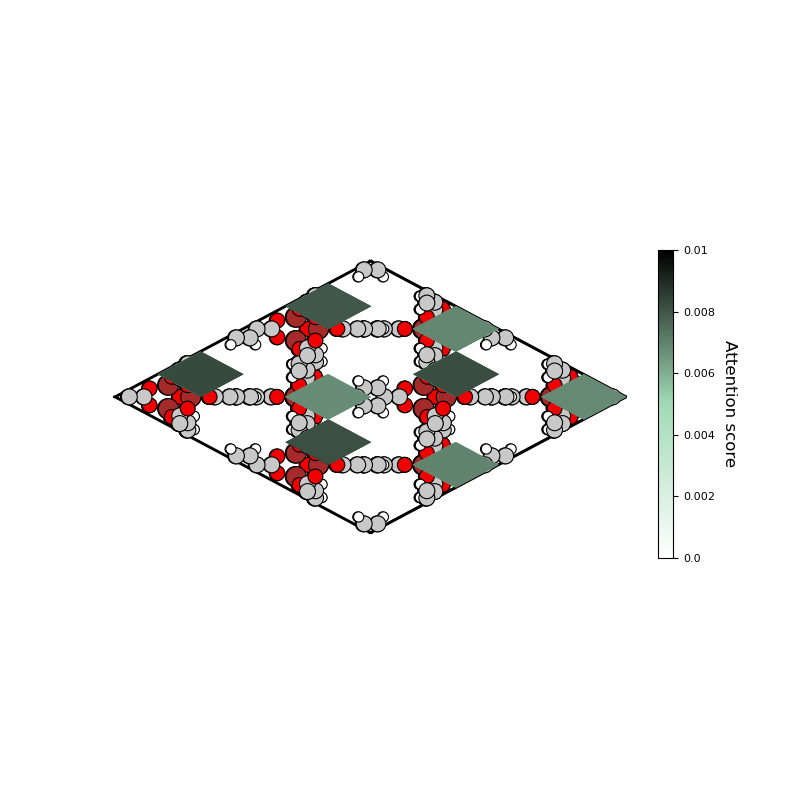
Visualize Energy-grid Embeddings
Here is an example of visualization with attention scores of Energy-grid embeddings:
%matplotlib widget
vis.draw_grid()
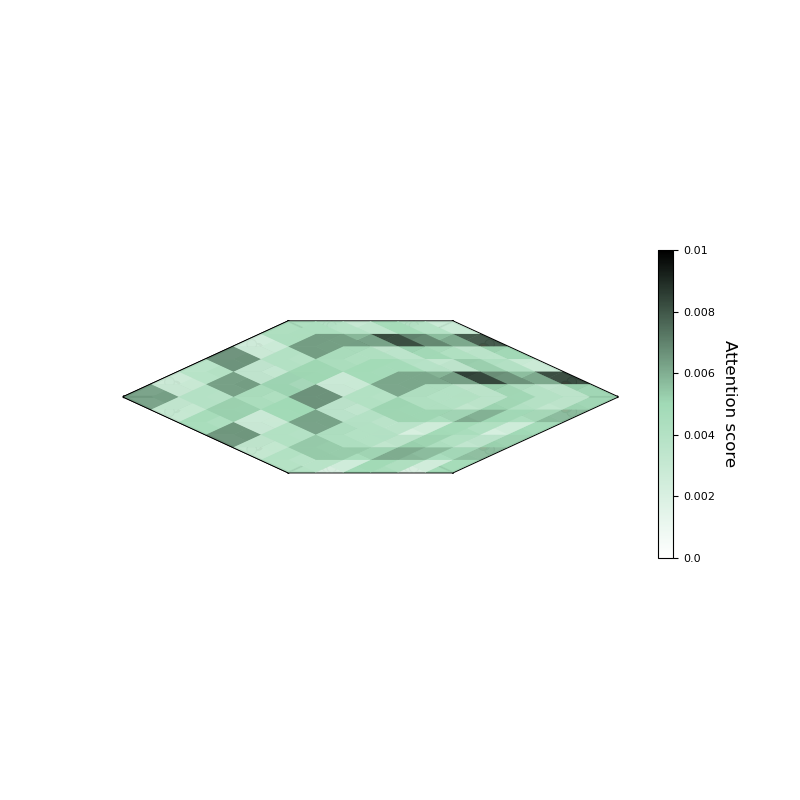
Likewise, you can change parameters of visualization.
If you want to visualize only patches that have higher attention scores than the minimum attention score min_att.
You just change a parameter remove_under_mitatt is True.
%matplotlib widget
minatt, maxatt = 0.005, 0.008
view_init=(0, -55)
cmap = 'rocket_r'
alpha = 0.3
grid_scale_factor = 1.8
atomic_scale_factor = 2

vis.draw_grid(minatt=minatt, maxatt=maxatt, view_init=view_init, alpha=alpha, cmap=cmap,
              grid_scale_factor=grid_scale_factor,
              atomic_scale_factor=atomic_scale_factor,
              remove_under_minatt=True)
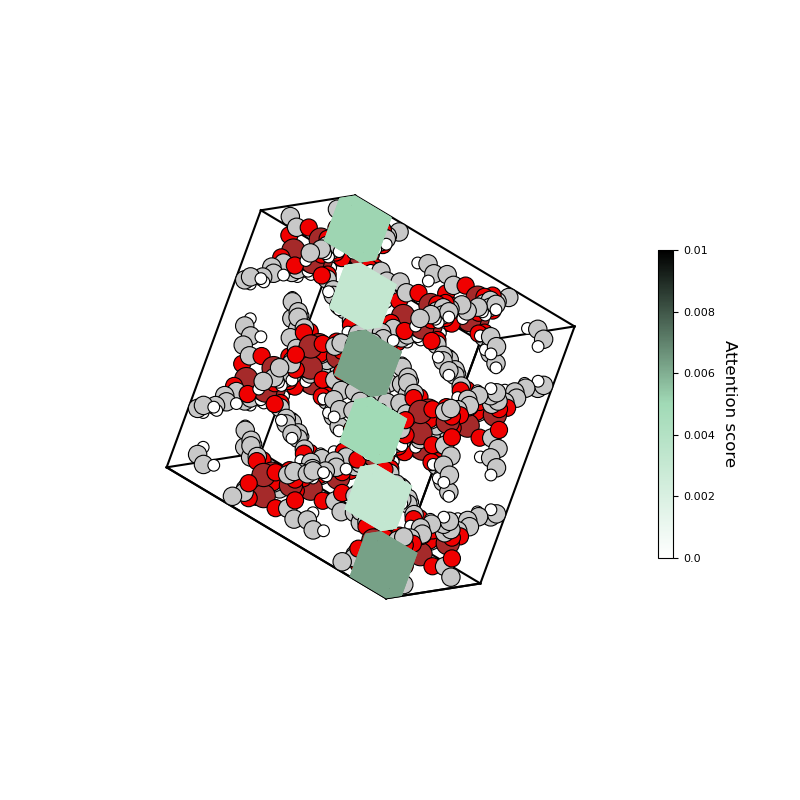
Also, you can visualize patches with patch positions out of 6 X 6 X 6 patches.
%matplotlib widget
view_init=(27, -92)
alpha = 1
grid_scale_factor = 1.8
atomic_scale_factor = 2
patch_list = [[0,0,0], [1,1,1], [2,2,2], [3,3,3], [4,4,4], [5,5,5]] # make list to patch

vis.draw_grid(view_init=view_init, alpha=alpha,
              grid_scale_factor=grid_scale_factor,
              patch_list=patch_list,
              atomic_scale_factor=atomic_scale_factor)
If you want to visualize patches according to a rank of attention scores of patches, you can use a rank parameter.
%matplotlib widget
view_init = (0, 125)
grid_scale_factor=1.8
atomic_scale_factor=1.5
rank = range(20)

vis.draw_grid_with_attention_rank(rank, view_init=view_init,
                                  grid_scale_factor=grid_scale_factor,
                                  atomic_scale_factor=atomic_scale_factor)
You can visualize a patch at a specific position of patches
%matplotlib widget
patch_position = [2, 2, 2]
view_init = (0, -55)

vis.draw_specific_patch(patch_position, alpha=0.5, view_init=view_init)
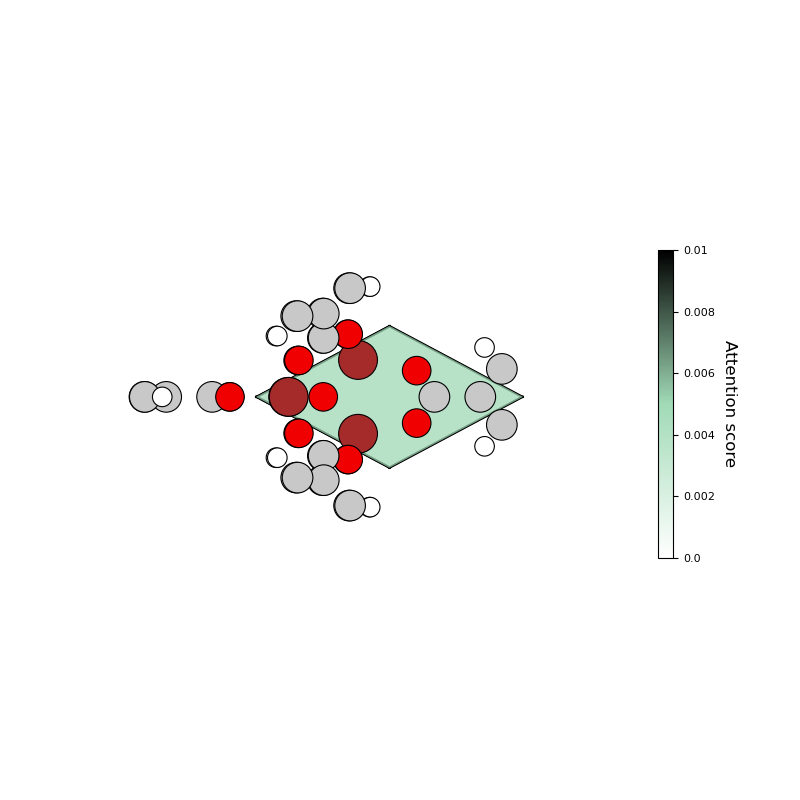
Also, you can visualize a patch with a rank of attention scores of patches.
view_init = (15, -58)

vis.draw_specific_patch_with_attention_rank(1, alpha=0.5, ep=0.8,
                                            view_init = view_init,
                                           grid_scale_factor=2)